Jlabs Analytics
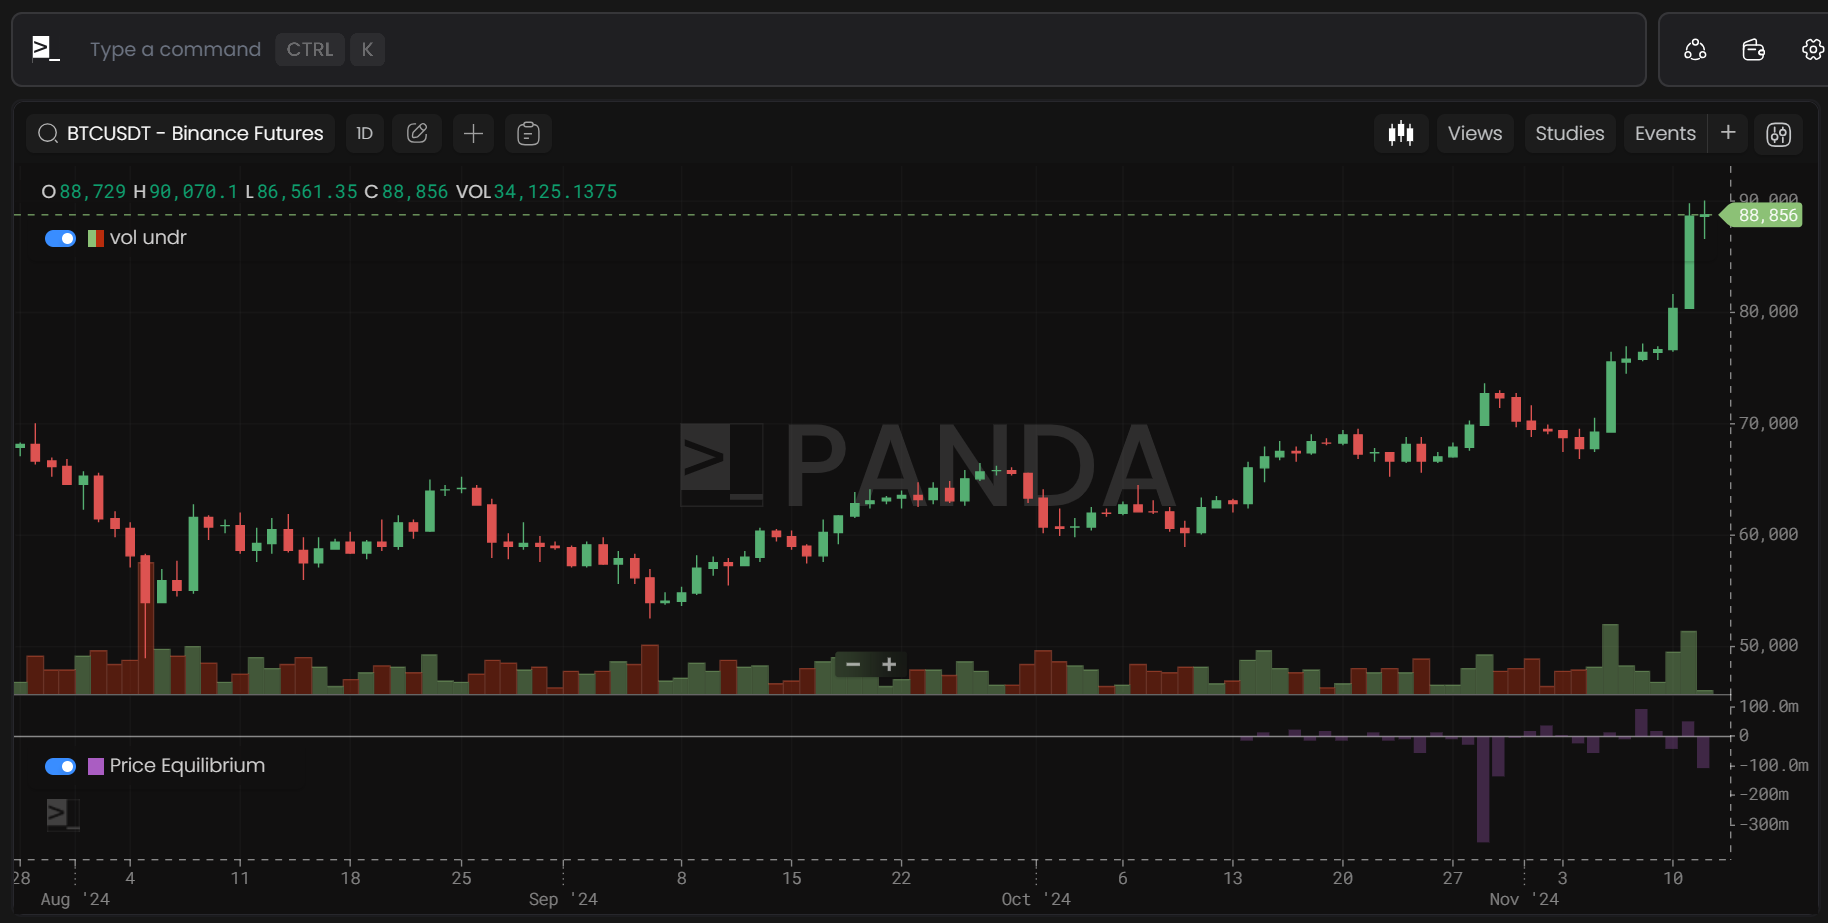
Price Equilibrium
Price Equilibrium is observed when high trade volumes don't impact the price, indicating an opposing market force absorbing these trades.
-
Chart Type: Hourly (The metric is computed hourly and so depending on your time zone, you might find the metric not displayed for the last (sometimes two) hours.)
-
Available Symbols:
BTCUSDT, ETHUSDT, MATICUSDT, LINKUSDT, BNBUSDT, XRPUSDT, LDOUSDT, ADAUSDT, DOGEUSDT, SOLUSDT, LTCUSDT, DOTUSDT, AVAXUSDT, UNIUSDT, ATOMUSDT, FILUSDT, APTUSDT, ARBUSDT, VETUSDT, APEUSDT, AAVEUSDT, OPUSDT, FTMUSDT, THETAUSDT, AXSUSDT, CRVUSDT, MKRUSDT, GMXUSDT
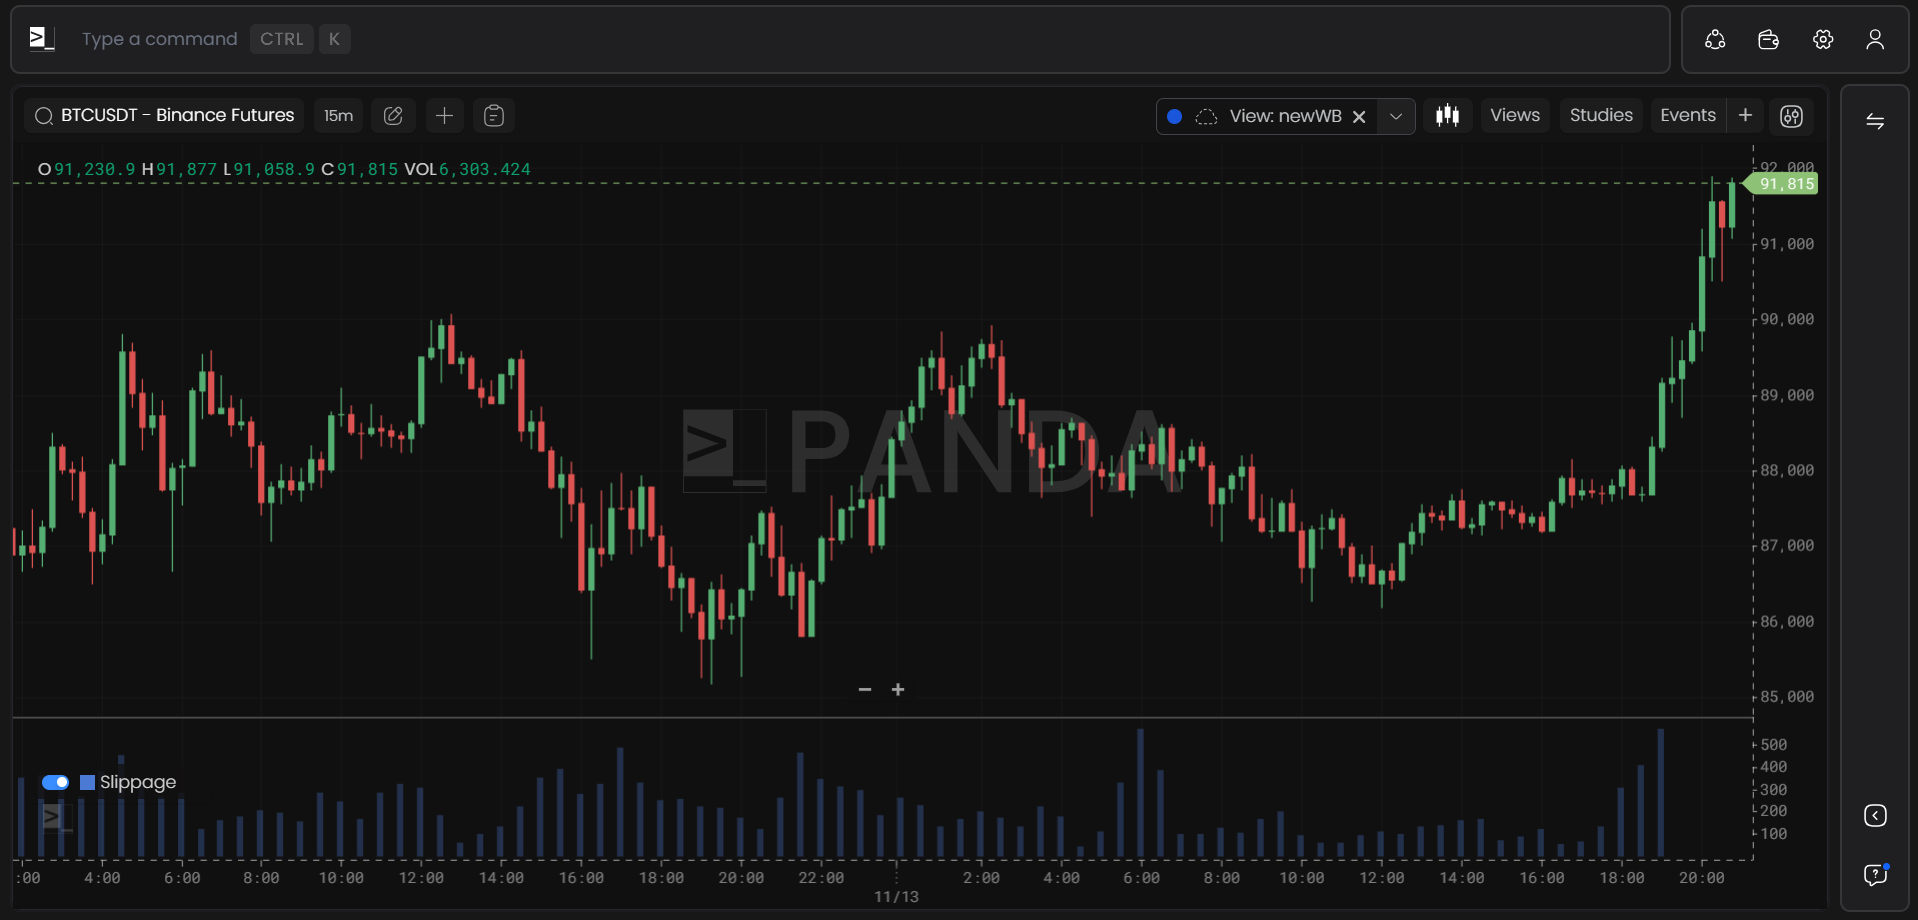
Slippage
Slippage in trading refers to the difference between the anticipated and actual execution price of a trade. It is most common to be high in volatile markets and large trades.
-
Chart Type: Hourly (The metric is computed hourly and so depending on your time zone, you might find the metric not displayed for the last (sometimes two) hours.)
-
Available Symbols:
BTCUSDT, ETHUSDT, MATICUSDT, LINKUSDT, BNBUSDT, XRPUSDT, LDOUSDT, ADAUSDT, DOGEUSDT, SOLUSDT, LTCUSDT, DOTUSDT, AVAXUSDT, UNIUSDT, ATOMUSDT, FILUSDT, APTUSDT, ARBUSDT, VETUSDT, APEUSDT, AAVEUSDT, OPUSDT, FTMUSDT, THETAUSDT, AXSUSDT, CRVUSDT, MKRUSDT, GMXUSDT