PANDA Intel
PANDA Intel, also known as “Events,” allows you to add indicators for specific metrics and set markers based on custom calculations. You can build your own custom indicators using Events.
This key feature enhances your analysis by highlighting important data points in your studies.
Creating PANDA Intel
Get started by following the simple steps below.
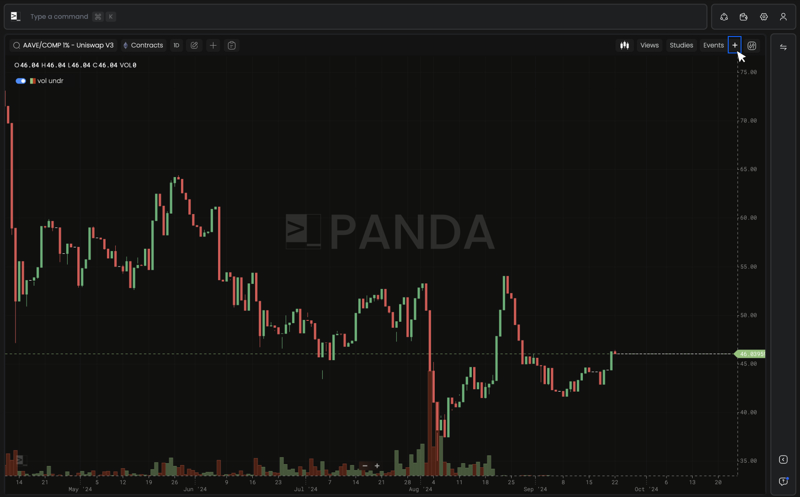
- Head over to the '+' icon beside the Events in the top-right of the chart navigation.
- Fill in the details regarding your indicator and save it.
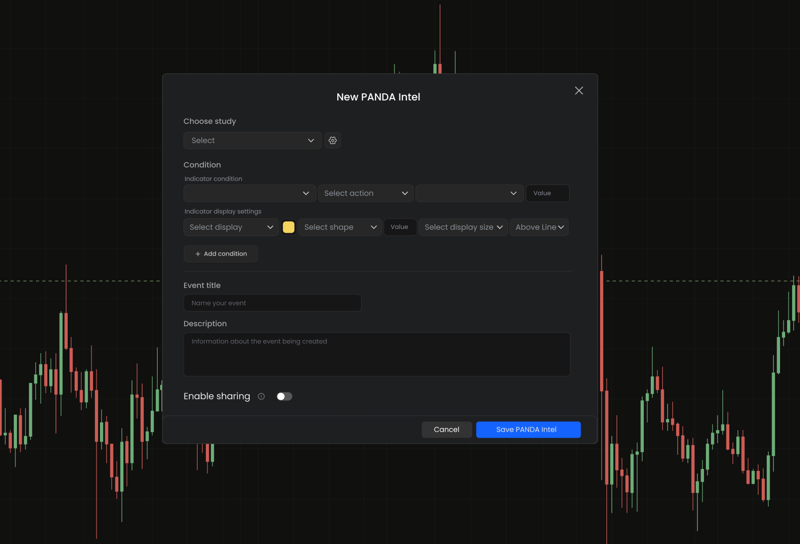
Indicator Details:
- Indicator Condition — The condition you want to view the indicator for. It is used to display events, which allows users to add signals for historical evaluation as well as ongoing analysis.
- Chart Marker / Indicator Display Settings — Appears as a circle, diamond, or square to indicate when a signal occurs. Shape color is user-selectable via a color picker and can include a single-character label. Clicking a marker opens the related study panel or shows/hides the study if it is on the primary series (see previous chart).
note
You can set multiple conditions for your PANDA Intel indicator.